WCRC Intelligence
India's factory output grows 6.7% as capital goods outrun consumers
India's Index of Industrial Production rose 6.7% in September on top of a strong base, carried by machinery, power equipment and industrial inputs. Everyday consumer goods barely moved, and that split now shapes the plans of consumer companies, lenders and foreign investors.
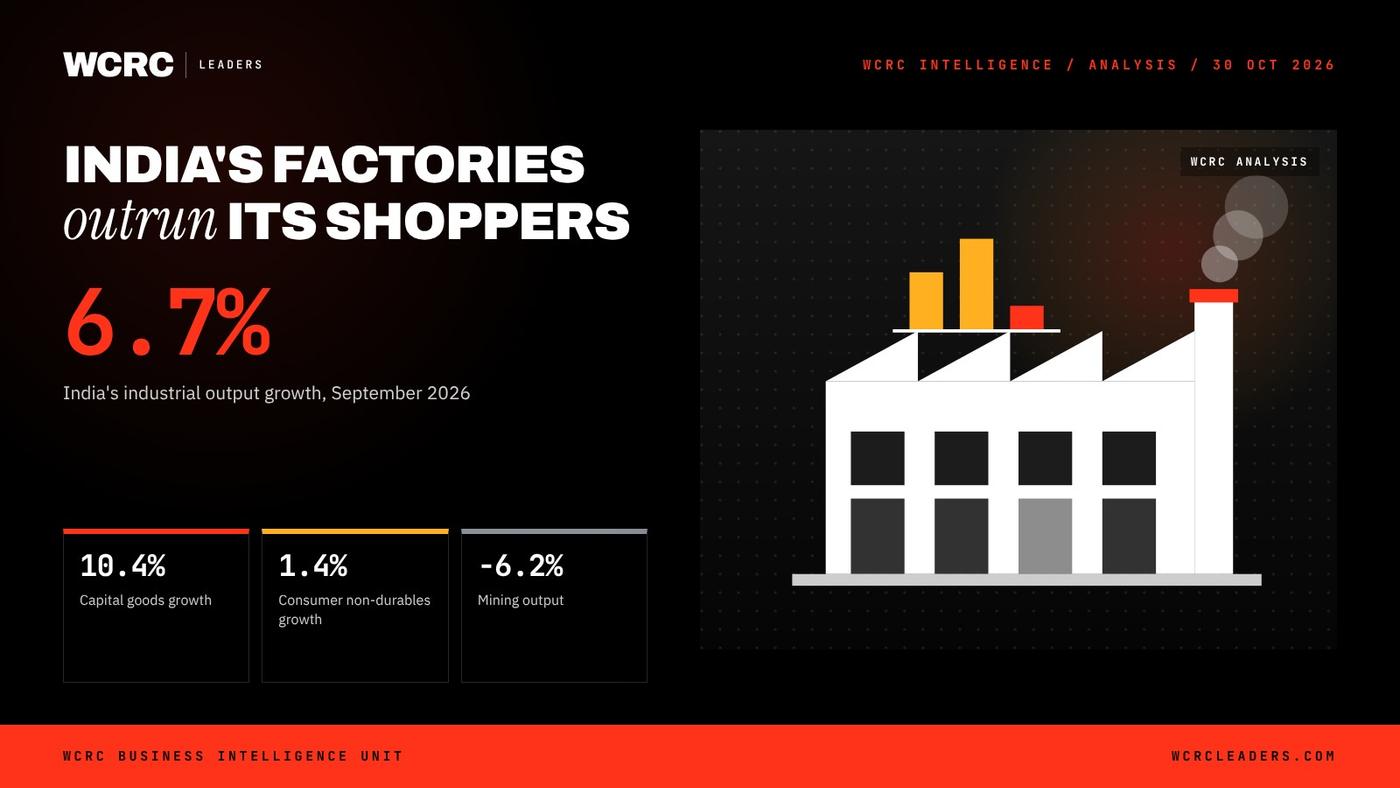
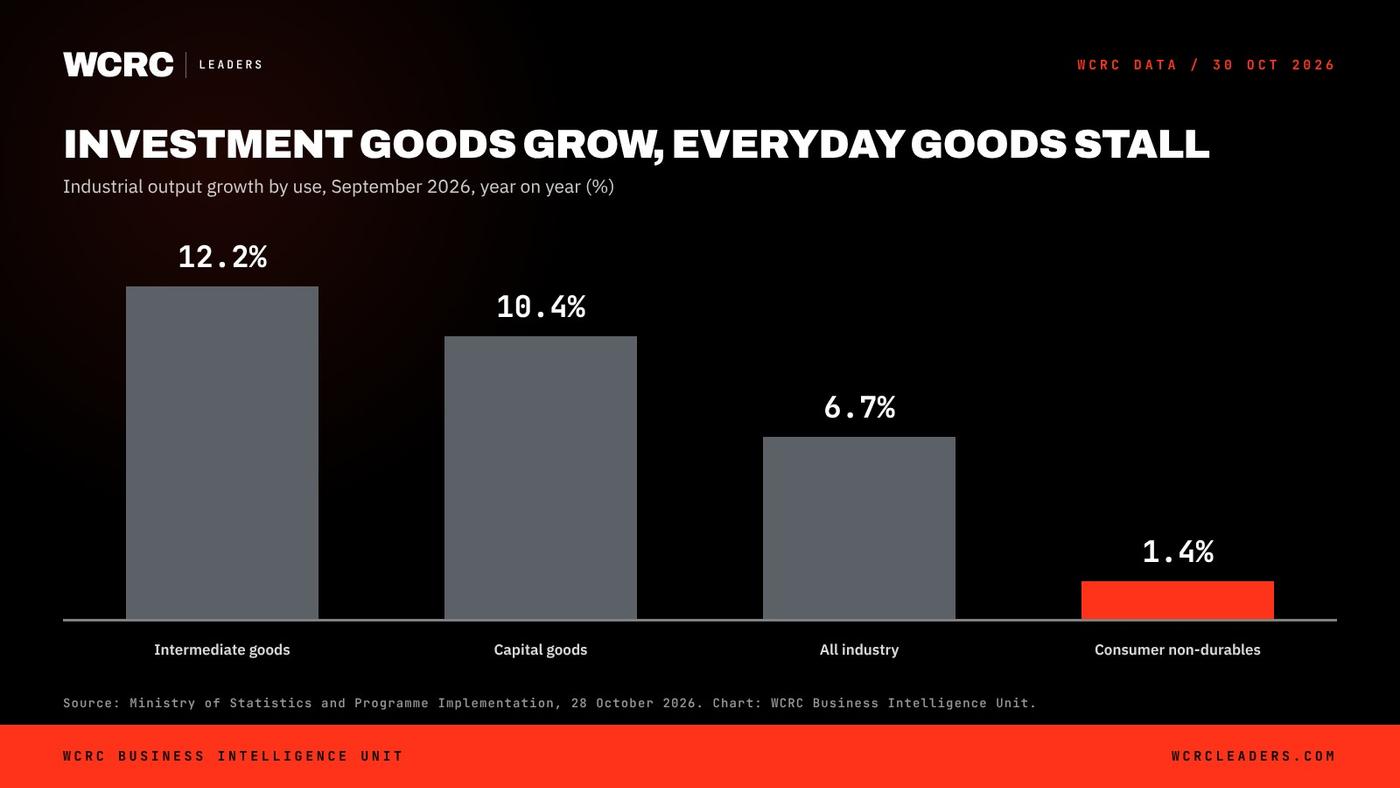
At a glance: WCRC Leaders' assessment: India's industrial cycle is being driven by investment, not households, and boards should plan for a two-speed economy into 2027. The Ministry of Statistics and Programme Implementation said on 28 October 2026 that industrial output grew 6.7% year on year in September, after a revised 7.8% in August. Intermediate goods rose 12.2% and capital goods 10.4%, while consumer non-durables grew only 1.4%. Mining fell 6.2%. The October figure is due on 30 November.
What did the September data show?
The quick estimate puts the general index at 124.3 on the new 2022-23 base, against 116.5 in September 2025. The growth came on a demanding base: output had already risen 6.1% in September 2025. For the first half of 2026-27, April to September, industrial production grew 6.8%.
Manufacturing, the largest part of the index, grew 7.6%. Electricity and gas supply rose 11.2%, and water supply, sewerage and waste management 5.8%. Mining and quarrying was the weak spot, down 6.2% in the month and 2.4% for the half year, with non-metallic minerals down 29.2%. The ministry gave no reason for the mining fall.
Breadth was healthy. Seventeen of the 23 manufacturing industry groups grew year on year. The ministry singled out electrical equipment, up 33.9%, rubber and plastics products, up 19.9%, and motor vehicles, trailers and semi-trailers, up 19.0%. Its tables also show beverages up 39.4%, other transport equipment up 19.1% and textiles up 17.4%.
The ministry also revised August from a first estimate of 8.0% to 7.8%. The September number rests on a response rate of 86.5%, so it too can move when the final figure is published.
This release follows the eight core industries data for September, which WCRC covered last week. The core index tracks basic inputs such as coal, steel and power. The IIP is the wider measure, and its real value lies in the split by use.
Who is buying what India makes?
The use-based classification tells the story. In September, intermediate goods grew 12.2%, capital goods 10.4%, infrastructure and construction goods 7.2%, consumer durables 6.0% and primary goods 4.0%. Consumer non-durables, the soaps, packaged foods and daily staples that most households buy every week, grew just 1.4%.
The half-year picture is starker. Between April and September, capital goods output rose 15.1% and intermediate goods 10.8%. Consumer durables grew 8.7%. Consumer non-durables grew 0.8%. In August, non-durables output actually fell 1.1%.
The index levels show how far the gap has opened since the base year. Analysis: with 2022-23 set at 100, capital goods stood at 153.4 in September and intermediate goods at 131.7, while consumer non-durables stood at 111.8. Put simply, India now makes roughly half as much again in machinery as it did three years ago, but only about an eighth more of the everyday goods its households consume.
Durables sit in between. Cars and appliances are growing, helped by credit and higher earners, but the mass market for staples is not keeping pace. That is the core of the two-speed reading.
Why is investment holding up while households hold back?
The official release does not explain causes, so what follows is WCRC analysis. Electrical equipment, power output and capital goods point to sustained spending on grids, generation, factories and infrastructure, much of it planned and funded well before the current cost shock. Projects already under way tend to keep running even when conditions tighten.
Households face a harder month. Wholesale inflation reached 11.39% in September, up from 9.92% in August, according to the Ministry of Commerce and Industry, as WCRC reported on the margin squeeze. The Reserve Bank of India raised the repo rate by 25 basis points to 5.50% on 7 October, its first increase since February 2023, and moved its stance to "calibrated tightening". WCRC's analysis of that decision looked at the cost for borrowers and the festive season.
When input prices climb faster than wages, mass-market buyers trim volumes or trade down first. Weak growth in non-durables output is consistent with that pattern, though one month of factory data cannot prove it.
What does it mean for consumer companies?
For fast-moving consumer goods makers, factory data showing near-flat non-durables output is a warning on volume. Companies such as Hindustan Unilever, one of WCRC 1000, India's Most Valuable Enterprises 2026, depend on that volume. WCRC's review of the company's quarter looked at its volume-led reset.
Read through the Price Power Model in WCRC's Brand & Marketing Codex, the question for staples brands is how much of an 11% wholesale cost surge they can pass on before buyers switch to cheaper packs or local rivals. In a market growing at about 1%, every price rise is a bet on loyalty. Read through the Love-to-Loyalty Funnel, a model in the same codex, the risk is that affection for a brand survives while the repeat purchase does not, because the shopper simply buys less often.
Durables makers sit in a better place. Maruti Suzuki, one of WCRC 1000, India's Most Valuable Enterprises 2026, is among the carmakers whose results WCRC reviewed this week, and motor vehicle output rose 19.0% in September.
What does it mean for lenders and for Gulf and Asian investors?
For banks, the mix of demand matters as much as the total. Analysis: strong capital and intermediate goods output points to steady demand for project loans, working capital and trade finance from industrial companies, now priced off a higher repo rate. Retail lending to lower-income households needs closer watching if staples demand stays flat while prices rise, since that is the segment where stress tends to appear first.
For Gulf sovereign funds and Asian strategic investors, the data favours the investment side of India's economy: electrical equipment, power, engineering and the supply chains that feed them. Larsen & Toubro, one of WCRC 1000, India's Most Valuable Enterprises 2026, is a bellwether for that side, and WCRC's review of its record order book looked at how a record order haul came with thinner margins. Investors betting on India's consumer story need more patience, and should test assumptions on volume rather than price.
In the terms of Corporate Value Intelligence, WCRC's framework for interpreting enterprise value, the question for boards is which part of their value rests on volume and which on pricing. A business priced for mass-consumption growth faces a different test from one priced for the capex cycle.
The WCRC View
The WCRC Business Intelligence Unit reads September's industrial data as confirmation that India is running on two engines at different speeds. Investment and industrial inputs are strong; mass consumption is close to stalling. Both are real, and planning on an average of the two would mislead.
In the terms of SeeClear, a model in WCRC's Guru Management Codex, leaders should separate fact from projection. The fact is 6.7% headline growth on a high base and 1.4% growth in staples. The projection that festive demand will soon close the gap is not yet in the data, and boards should not budget as if it were.
Who gains: makers of electrical equipment, capital goods and industrial inputs, their lenders and the investors who back them. Who is exposed: mass-market consumer companies relying on price rises, and lenders with heavy exposure to stretched households. Read through the Price Power Model, staples companies should protect volume before margin, and use smaller packs and value lines rather than headline price increases where they can.
What leaders in India, the Gulf and Asia should do now: build 2027 plans on two scenarios for consumption, stress-test capex funding against a 5.50% repo rate and a possible further rise, and track volume, not revenue, as the leading indicator of consumer health.
What WCRC will watch next: the October IIP on 30 November, which will show whether festive production lifted non-durables, and the RBI policy meeting on 2 to 4 December. If staples output is still flat after the festive months, the consumption slowdown is no longer a timing effect.
WCRC models applied: Price Power Model, Love-to-Loyalty Funnel, SeeClear, Corporate Value Intelligence.
Quick answers
Q: How much did India's industrial output grow in September 2026? A: The Index of Industrial Production grew 6.7% year on year, according to the quick estimate released by the Ministry of Statistics and Programme Implementation on 28 October 2026. August growth was revised to 7.8%.
Q: Which parts of industry grew fastest? A: Intermediate goods rose 12.2% and capital goods 10.4%. Among manufacturing groups, electrical equipment grew 33.9%, rubber and plastics products 19.9% and motor vehicles 19.0%. Electricity output rose 11.2%.
Q: Why is consumption described as weak? A: Consumer non-durables output grew only 1.4% in September and 0.8% between April and September 2026, and fell 1.1% in August. Consumer durables did better, at 6.0% in September.
Q: When is the next IIP release? A: The October 2026 figures are due on Monday 30 November 2026.
AI-native vs AI-retrofit: the growth gap incumbents should study
The AI trade economy: chips and servers now carry almost half of world trade growth
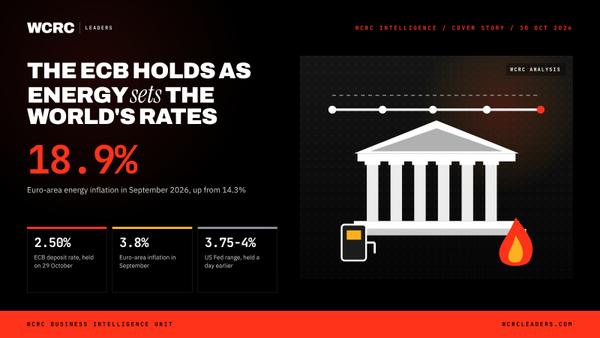
ECB holds at 2.50% as 18.9% energy inflation sets the world's rates
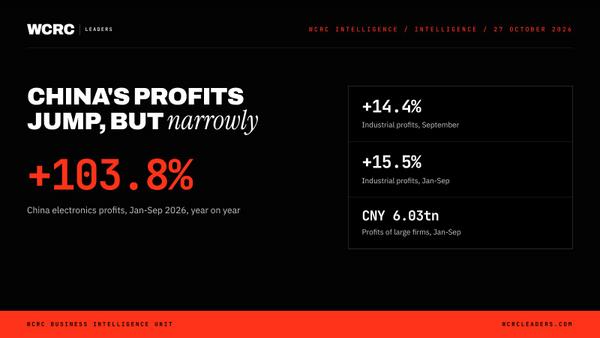
China's profits jump 14.4%: chips and metals boom, steel and cars bleed
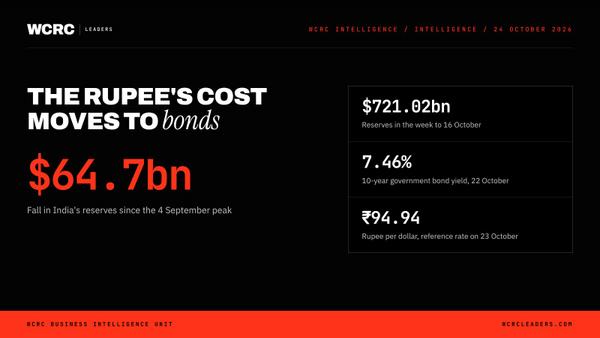
India's 10-year yield hits 7.46% as reserves fall $64.7bn from peak
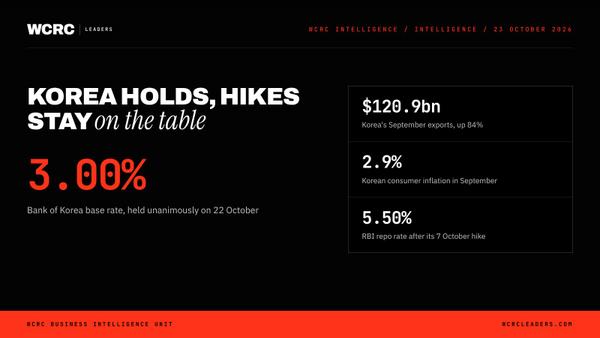
Bank of Korea holds at 3.00% and keeps more hikes on the table
Filed under