WCRC Intelligence
India's core sector grows 7.9% in September despite the oil shock
India's nine core industries grew 7.9% in September 2026, up from 5.9% in August, as power, coal, iron ore and cement ran hot. The data says heavy industry is still building, even with wholesale inflation above 11% and the RBI tightening.
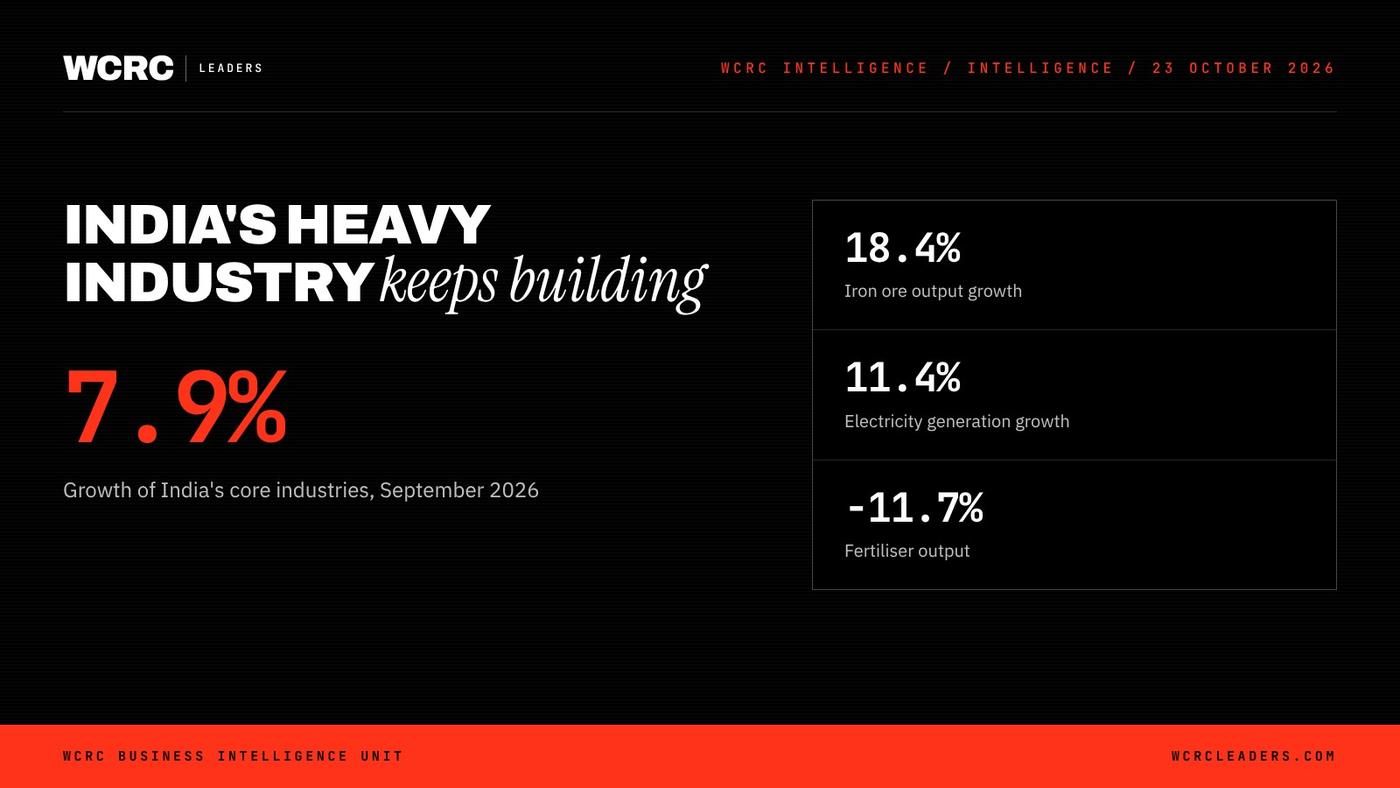
At a glance: WCRC Leaders' assessment: India's industrial engine is accelerating into the oil shock, not stalling, which means Q2 growth will hold up but boards should expect costs, not demand, to be the binding constraint for the next two quarters. The Office of the Economic Adviser, Ministry of Commerce and Industry, released the September Index of Core Industries on 21 October. The index grew 7.9% year on year, up from a revised 5.9% in August. Six of nine industries grew. Fertilisers, natural gas and crude oil fell.
What did the September data show?
The Index of Core Industries stood at 118.3 in September 2026 on the new 2022-23 base, according to the official release published on 21 October. Growth of 7.9% compares with 5.9% in August, a month that was itself revised up from a provisional 4.8% (the August index moved from 119.2 to 120.4).
The gains were broad in the industries that matter for building things:
| Industry | Weight in index | Growth, Sept 2026 | Growth, Apr-Sept 2026 |
|---|---|---|---|
| Iron ore | 4.905 | 18.4% | 21.2% |
| Electricity | 30.932 | 11.4% | 10.2% |
| Coal | 5.596 | 10.7% | -1.0% |
| Refinery products | 22.572 | 10.3% | 1.0% |
| Cement | 4.41 | 9.8% | 10.1% |
| Steel | 17.584 | 4.9% | 4.3% |
| Crude oil | 7.43 | -1.4% | -3.7% |
| Natural gas | 3.841 | -4.6% | -4.4% |
| Fertilisers | 2.731 | -11.7% | -7.6% |
For April to September 2026, the index grew 5.1%, double the 2.5% of the same period a year earlier.
Two technical points matter for reading the number. First, this is a new series. In July the Office of the Economic Adviser moved the index to a 2022-23 base, added iron ore as a ninth industry and switched steel to gross production data. Second, electricity, refinery products and steel together carry about 71% of the weight. When power and refining both run at double digits, the headline moves fast.
Under the new series, monthly growth has now run at 5.0% in June (first estimate), 5.4% in July, 5.9% in August and 7.9% in September. The direction is clear.
Why does it matter for Q2 GDP?
Core industries account for a large share of India's Index of Industrial Production, so the September print is an early read on factory output for the July to September quarter.
The starting point is already strong. Real GDP grew 7.8% in April to June 2026, with manufacturing gross value added up 9.2%, according to official estimates published on 1 September. The RBI's Monetary Policy Committee, in minutes released on 21 October, projects Q2 growth at 7.2% and full-year 2026-27 growth at 7.1%, easing to 6.9% in Q3.
WCRC analysis: A quarter in which core output accelerated from July to September makes the RBI's 7.2% Q2 projection look reachable rather than generous. The risk to Q2 is not volume; it is the gap between nominal and real growth. With wholesale prices rising fast, the GDP deflator will be high, and real growth could print lower than the activity data alone suggest.
The next checkpoints are the September Index of Industrial Production from MoSPI later this month and the October core index on Friday, 20 November.
How does strong output square with the oil shock and high WPI?
It squares because the core index measures volumes, not margins.
Wholesale inflation reached 11.39% in September, up from 9.92% in August, according to the Office of the Economic Adviser's release of 14 October. Fuel and power prices rose 25.85%. Crude petroleum and natural gas rose 57.32%. Basic metals rose 16.96%. We set out what that means for pricing power in India's 11.39% wholesale inflation: the margin squeeze is here.
The core data shows where the shock is biting and where it is not. Domestic crude oil output fell 1.4% and natural gas 4.6%, so India is not producing its way out of the import bill. Fertilisers, which rely heavily on gas, fell 11.7%. That is the clearest sign that expensive feedstock is cutting output in gas-dependent industry.
Refinery products, by contrast, grew 10.3%. Refiners are running hard. Electricity grew 11.4% and coal 10.7%, which points to steady industrial and household power demand met largely by domestic coal rather than imported gas.
The RBI has responded to the price side. On 7 October it raised the repo rate by 25 basis points to 5.50%, its first increase since February 2023, and moved its stance to "calibrated tightening". The committee projects CPI inflation at 5.2% for 2026-27, peaking at 6.0% in Q3. Our read of that decision is in India's first rate hike since 2023: what it means for capex and the festive season.
What does this mean for CEOs in India?
Capex. Cement up 9.8% and iron ore up 18.4% in the month, with both above 10% for the half-year, point to a construction and infrastructure cycle still in full swing. One MPC member, Dr Nagesh Kumar, noted in the October minutes that gross fixed capital formation reached 34.3% of GDP in Q1, up from 31.4% a year earlier, and that capital goods have posted double-digit growth for four months. The committee expects capacity utilisation, credit flows and public infrastructure spending to sustain investment.
Power. Electricity growth above 10% for the half-year is a planning signal for any energy-intensive business. Power availability and tariffs, not demand, are the variables to watch in 2027 budgets.
Steel. Steel grew a more modest 4.9%, while iron ore surged. WCRC analysis: That gap suggests ore supply is running ahead of finished steel, which should keep raw material costs for domestic mills in check even as basic metals prices rise at the wholesale level.
Cement. Demand is strong, but cement is a fuel-intensive product. With fuel and power wholesale prices up more than a quarter, cement makers face the classic squeeze: full order books and rising kiln costs.
What does it mean for Gulf and Asian suppliers and investors?
For Gulf energy exporters, the data confirms that Indian demand for crude and refined products is holding. Refinery output is up and domestic crude production is down, so India's import need is structural. The risk sits on the supply side, which we covered in 135 attacks since February: what Gulf and Indian boards must price in.
For gas and fertiliser suppliers, the 11.7% fall in Indian fertiliser output is a demand signal. If domestic plants cut runs because gas is too expensive, India will lean on imports of finished fertiliser ahead of the rabi season.
For Asian suppliers of machinery, electrical equipment and construction inputs, strong cement, iron ore and power numbers mean Indian project pipelines are moving. For investors, the core data supports the case that India's growth is investment-led. It also sits beside a firm export half-year, set out in India's $476bn half-year: electronics and the US outrun the Gulf shock.
The WCRC View
The call. From the WCRC Business Intelligence Unit: September's 7.9% is the strongest evidence yet that India's investment cycle has enough momentum to absorb an oil shock and a rate hike in the near term. Volumes are not the problem. Costs are.
Who gains. Coal, power, cement, iron ore and refining businesses with domestic inputs gain the most: they have demand and partial insulation from imported fuel. Suppliers of capital goods into Indian infrastructure also gain. Gas-dependent industries, fertilisers first, lose; their output data already shows it.
What leaders should do now. Boards in India should plan 2027 budgets on the assumption that demand holds and input costs stay high, not the reverse. Test every major capex line against a 5.50% repo rate and a further hike in December. Secure power and fuel contracts now, while volumes are rising. Gulf and Asian suppliers should treat India as a volume market in 2027 and price for currency and freight risk, not demand risk.
The risk to this view. If the core strength reflects a pre-festival production push rather than durable demand, October data will show it. A sharp slowdown in electricity and cement would be the first warning.
What WCRC will watch next. The September Index of Industrial Production later this month; the October core index on 20 November; MoSPI's Q2 GDP estimates; and the RBI's policy decision after its 2 to 4 December meeting.
Quick answers
Q: How much did India's core industries grow in September 2026? A: The Index of Core Industries grew 7.9% year on year in September 2026 (provisional), up from a revised 5.9% in August, according to the Office of the Economic Adviser.
Q: Which core industries grew fastest? A: Iron ore grew 18.4%, electricity 11.4%, coal 10.7%, refinery products 10.3% and cement 9.8%. Fertilisers fell 11.7%, natural gas 4.6% and crude oil 1.4%.
Q: What was cumulative growth for April to September 2026? A: The index grew 5.1% in April to September 2026, against 2.5% in the same period of 2025.
Q: When is the next core industries release? A: The October 2026 index is due on Friday, 20 November 2026.
The AI trade economy: chips and servers now carry almost half of world trade growth
Bank of Korea holds at 3.00% and keeps more hikes on the table

The AI adoption gap: what the World Bank's new numbers say about emerging markets

Jio's IPO, China's GDP: the leaders' week ahead, 19 to 25 October

The $6 trillion question: is AI spending outrunning AI revenue?
India's 11.39% wholesale inflation: the margin squeeze is here
Filed under