WCRC Intelligence
India's $476bn half-year: electronics and the US outrun the Gulf shock
India's total exports grew 10.99% in September, despite a renewed conflict in West Asia that pushed up crude prices. Electronics and the American market did the heavy lifting, while a services surplus of $102.71bn covered more than half of a widening goods deficit.
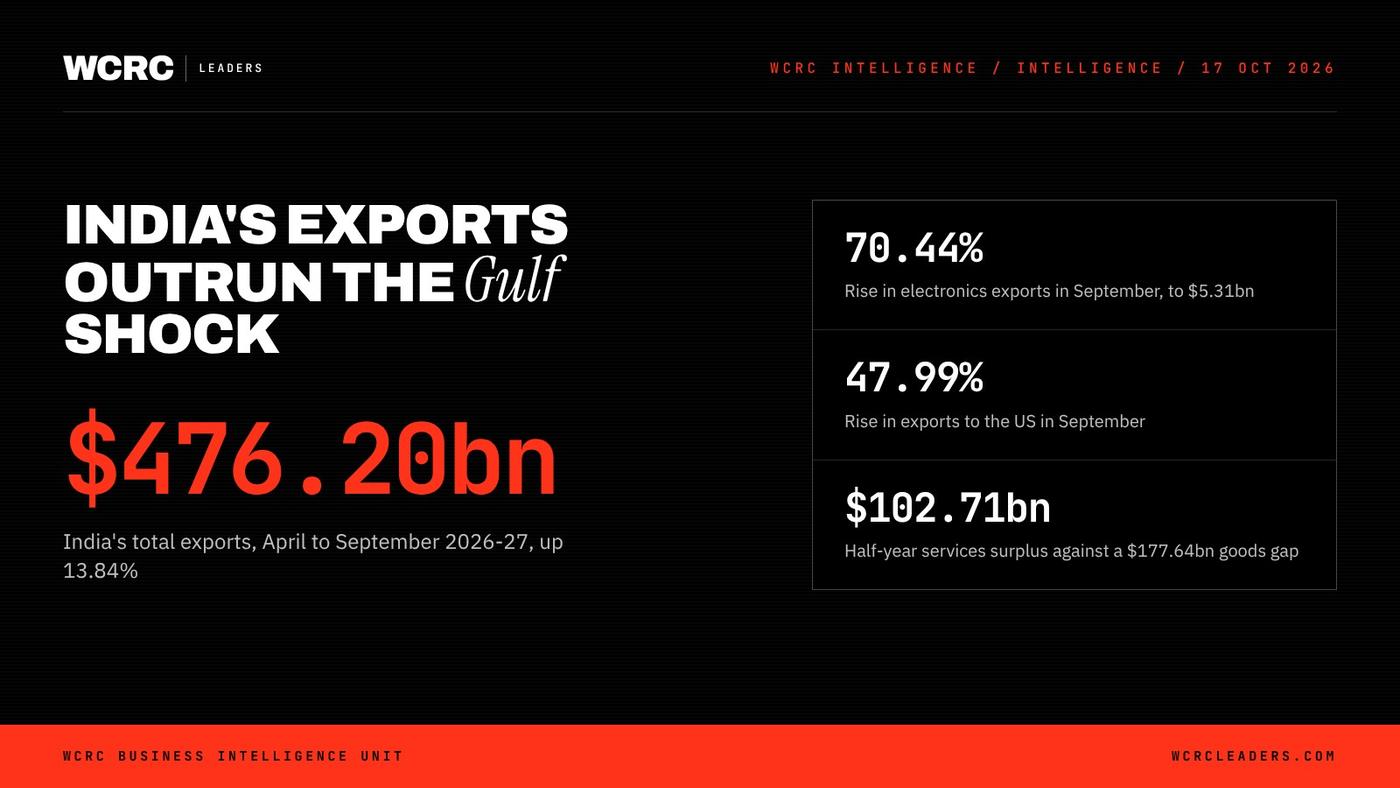
At a glance: WCRC Leaders' assessment: India's export engine is now strong enough to absorb an oil shock, but not strong enough to close the goods gap, so services and capital flows remain the country's real shock absorber. The Ministry of Commerce and Industry's data for September 2026, released on 15 October, put first-half exports of goods and services at $476.20bn, up 13.84%. For boards, it shows where demand is growing, and where the import bill is rising.
What did September's numbers show?
India's total exports of goods and services in September 2026 were estimated at $80.75bn, up 10.99% from $72.76bn a year earlier, according to the Ministry of Commerce and Industry. Total imports rose 8.19% to $94.05bn. Because exports grew faster than imports, the overall trade deficit narrowed to $13.30bn from $14.17bn in September 2025.
Goods carried the month. Merchandise exports rose to $44.40bn from $36.08bn, a gain of about 23% on WCRC's calculation from the ministry's figures. Merchandise imports grew far more slowly, by about 8%, to $74.61bn. Services were softer: exports were estimated at $36.35bn, slightly below $36.67bn a year earlier, while services imports rose to $19.44bn. The ministry notes that the September services figures are estimates, because the latest Reserve Bank of India (RBI) data covers August.
Across the first half, April to September 2026-27, total exports reached $476.20bn, up from $418.31bn. That is already more than half of the $863.1bn record India reported for the whole of 2025-26. Merchandise exports for the half were $259.89bn, up 18.51% from $219.30bn.
The trend has held through the year. Cumulative export growth was 11.37% at the end of June, 13.16% at the end of July and 15.55% at the end of August, before easing to 13.84% in September.
Where did the growth come from?
Two forces stand out in the September data: electronics and the United States.
Exports of electronic goods rose 70.44% to $5.31bn from $3.11bn, the fastest growth of any major commodity group. This follows an 89.82% rise in August, to $5.55bn. Engineering goods, still India's largest export category, grew 20.91% to $12.17bn. Chemicals rose 24.21% to $2.94bn. Drugs and pharmaceuticals managed only 4.68%.
By market, exports to the United States rose 47.99% in September, against 21.83% in August. Singapore, Malaysia and Egypt also grew strongly. Over the full half-year, growth to the US was a steadier 11.11%. Singapore (up 103.05%), China (36.07%) and Malaysia (82.85%) grew faster.
WCRC analysis: the electronics surge and the jump in American demand are most likely the same story. India's electronics exports are increasingly assembled for the US market, and growth to Singapore and Malaysia points to India sitting more deeply inside Asian supply chains. The concentration cuts both ways. A single product group and a single market now drive much of the gain, so a change in US trade policy or in one large manufacturer's sourcing plans would show up quickly in India's figures.
Petroleum products also helped. Their exports rose 31.90% to $6.22bn in September. Non-petroleum exports, a better guide to underlying competitiveness, grew to $38.18bn from $31.37bn, and were up 15.56% for the half.
How big is the goods gap, and how much do services cover?
The headline export growth hides a growing imbalance in goods. Merchandise imports for April to September were $437.53bn, up from $376.17bn. The merchandise trade deficit widened to $177.64bn from $156.88bn a year earlier, an increase of more than $20bn.
Services cushion much of that gap. Services exports for the half were estimated at $216.31bn, up 8.69%, against services imports of $113.60bn. That gives a services surplus of $102.71bn, up from $98.77bn, which offsets about 58% of the goods deficit. Even so, the combined trade deficit for goods and services widened to $74.93bn from $58.10bn, because imports grew faster than exports over the half: 15.68% against 13.84%.
The RBI's latest policy statement shows why this matters. Its Governor's statement of 7 October said that India's current account deficit remained "modest and well below the sustainable levels", but noted that it widened in July 2026, despite the services surplus and net remittances.
What does the Gulf conflict mean for the import bill?
The RBI's Monetary Policy Committee cited "the re-escalation of the conflict in West Asia and the consequent sharp volatility in crude oil prices" as a main source of global uncertainty. The Governor's statement dated the "sudden reescalation" to September.
The ministry's release does not report crude oil imports separately, but its own figures make the effect clear. Total merchandise imports minus non-petroleum imports give petroleum imports of about $18.34bn in September, against about $14.03bn a year earlier, a rise of roughly 31% on WCRC's calculation. For the half, the same method gives petroleum imports of about $113.83bn, up from $92.09bn. Non-petroleum imports grew only 2.2% in September.
The Gulf's role as a supplier is shifting. Imports from Oman rose 331.82% in September and 210.90% across the half. The Gulf also remains a large market for Indian goods: the ministry reported $37.36bn of 2025-26 exports to the UAE under the India-UAE trade agreement, the largest of any of India's free trade partners.
Gold worked the other way. Gold imports fell 81.27% in September, after a 57.75% fall in August, and silver imports fell 49.11%. That sharp drop in precious metals is the main reason the overall September deficit narrowed even as oil became more expensive. Leaders should not assume it will last.
How does the RBI's rate hike change the picture?
On 7 October, the RBI raised the repo rate by 25 basis points to 5.50% in a unanimous vote, and changed its stance to "calibrated tightening". It projects consumer price inflation at 5.2% for 2026-27, peaking at 6.0% in the October to December quarter, and real GDP growth at 7.1%.
The central bank sees trade as a support. Its committee noted that merchandise exports registered double-digit growth in the second quarter and said that "bilateral trade agreements should boost merchandise exports". On the currency, the Governor said the RBI remains "committed to ensuring orderly adjustments to the exchange rate", and described foreign exchange reserves as adequate.
WCRC analysis: the RBI's wording points to a gradual weakening of the rupee, not a defended level. That helps exporters' margins, but it makes the oil bill and imported components dearer. Electronics exporters, who import a large share of their inputs, gain less from a weaker rupee than textile or engineering firms with more local content. Dearer credit will also weigh on working capital.
The WCRC View
From the WCRC Business Intelligence Unit.
The call. India's trade position is better than the conflict headlines suggest, and weaker than the export growth suggests. Exports are growing at double digits through an oil shock, which is a real gain. But the goods deficit is still widening, and it is being covered by services and a collapse in gold buying that will not last.
Who gains. Electronics and engineering exporters with US orders, firms plugged into Singapore and Malaysian supply chains, and IT and business services companies whose surplus keeps the current account in check. Refiners also gain from higher product prices.
Who loses. Oil-intensive sectors such as aviation, chemicals, logistics and fertilisers, and any firm that relies on imported inputs priced in dollars while it sells in rupees. Suppliers of gold and silver to India, including Gulf trading hubs, face much lower volumes for as long as the fall in precious metal imports lasts.
What leaders should do now. Boards in India should stress-test budgets for higher oil prices, a weaker rupee and dearer credit at the same time, not one at a time. Exporters with heavy US exposure should map their customer concentration and diversify into the Asian markets that are already growing fastest. Gulf and Asian companies supplying India should expect steady demand for energy and components, but tougher price talks.
What WCRC will watch. The October trade release, due in mid-November, for whether festive gold buying returns; the RBI's December policy meeting and its next current account data; oil prices as the West Asia conflict develops; and whether electronics growth to the US holds once the current order cycle ends. For more on prices, see our analysis of India's September wholesale inflation, and on borrowing costs, India's first rate hike since 2023. For the global picture, read how chips and servers now carry almost half of world trade growth.
Quick answers
Q: How much did India export in September 2026? A: Total exports of goods and services were estimated at $80.75bn, up 10.99% from $72.76bn in September 2025. Merchandise exports were $44.40bn.
Q: What were India's exports for April to September 2026-27? A: Total exports were $476.20bn, up 13.84% from $418.31bn. Merchandise exports were $259.89bn, up 18.51%.
Q: How large is India's trade deficit? A: The overall deficit was $13.30bn in September. For the half-year, the merchandise deficit was $177.64bn, partly offset by a services surplus of $102.71bn, leaving a combined deficit of $74.93bn.
Q: Which sectors and markets led growth? A: Electronic goods exports rose 70.44% to $5.31bn in September, and exports to the US rose 47.99%. Engineering goods grew 20.91% to $12.17bn.
Filed under